
Introduction
Spring Boot is a popular framework for building Java applications, widely adopted in cloud-native and containerized environments. As applications increasingly run in dynamic infrastructures like Kubernetes, startup time has become an important metric, impacting scalability, resilience (recovery after failure), and developer productivity.
This article investigates how different build and runtime configurations affect the startup time of a Spring Boot application.
Why does startup time matter?
In modern cloud-native applications, startup time is an important factor. Faster startup times lead to:
- Improved scalability: Applications can scale up more quickly in response to demand.
- Reduced cold start latency: Particularly important for serverless applications where functions need to start quickly.
- Optimized CI/CD pipelines: Faster startup times can lead to quicker feedback loops from integration tests in continuous integration and deployment processes.
- Faster development cycles: Developers can iterate and test changes more rapidly.
- Improved resilience: Applications can recover from failures more quickly, maintaining availability.
Measurement Results
Summary
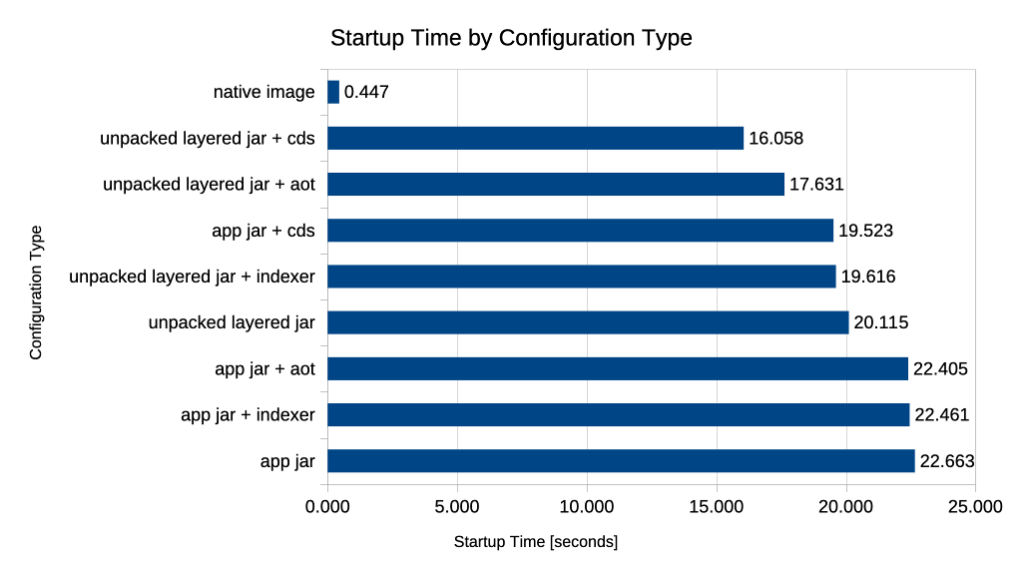
The following chart summarizes the average startup times for each configuration tested.
Conclusions
- native image is by far the fastest option, starting in less than half a second, delivers 98.03% optimization compared to a worst case scenario
- mind risks of using native image, especially regarding reflection, proxies, and other dynamic features of Java
- using unpacked layered jar with CDS provides the best performance among JVM-based options, reducing startup time by almost 30%
- using CDS without layered jars provides some improvement in startup time (almost 14%)
- using Spring Indexer provides a small improvement in startup time (1% – 3%)
- AOT Cache does not provide as good improvements in startup time as CDS, CDS is faster by 6.95% for unpacked layer case and faster by 12.72% for app jar case
- using layered jars provides a noticeable improvement in startup time compared to a standard jar
Raw Data
| Configuration | Measurement #1 [s] | Measurement #2 [s] | Measurement #3 [s] | Average [s] | % Relative to Base | Optimization vs Base |
|---|---|---|---|---|---|---|
| app jar | 22.043 | 22.583 | 23.363 | 22.663 | 100.00% | 0.00% |
| app jar + indexer | 22.406 | 21.840 | 23.136 | 22.461 | 99.11% | 0.89% |
| app jar + cds | 18.055 | 20.519 | 19.994 | 19.523 | 86.14% | 13.86% |
| app jar + aot | 23.404 | 21.633 | 22.179 | 22.405 | 98.86% | 1.14% |
| unpacked layered jar | 19.646 | 20.370 | 20.329 | 20.115 | 88.76% | 11.24% |
| unpacked layered jar + indexer | 19.204 | 20.085 | 19.560 | 19.616 | 86.56% | 13.44% |
| unpacked layered jar + cds | 16.639 | 15.977 | 15.557 | 16.058 | 70.85% | 29.15% |
| unpacked layered jar + aot | 17.376 | 18.204 | 17.314 | 17.631 | 77.80% | 22.20% |
| native image | 0.439 | 0.467 | 0.436 | 0.447 | 1.97% | 98.03% |
Methodology
How did I measure startup time?
Startup time for each different type of configuration was measured under an isolated Docker run with limited resources (CPU: 0.5 vCPU, Memory: 768MB RAM), to simulate execution under container runtime (for example, Kubernetes) with limited resources assigned to each POD.
To get closer to a real-world scenario, the application contains REST API and is configured to connect to a PostgreSQL database. Liquibase is used to manage the database schema.
How to reproduce the results?
To reproduce the results, visit the GitHub repository https://github.com/dominikcebula/spring-boot-startup-times, and follow the How to Run section in the README.md file.
Technologies Used
- Java 21, Java 24
- Spring Boot 3.5.x
- Spring Native
- Spring Indexer
- Layertools
- CDS
- AOT Cache
- Docker
- Docker Compose
- Maven
OS, Hardware, and Limits
- OS: Linux, Ubuntu 24.04.3 LTS, Kernel 6.8.0-78-generic SMP x86_64
- CPU: Intel(R) Core(TM) i7-12700 12th Gen 12 Cores, 20 Threads, 25M Cache, up to 4.90 GHz
- Memory: 2x16GB DDR4 3200 MHz Samsung M378A1K43EB2-CWE
- Storage: SSD NVMe M.2 2280 PCIe 3.0 x4 1TB Samsung MZVLQ1T0HBLB-00BH1
- Limits during measurements
- CPU: 0.5 vCPU
- Memory: 768MB RAM
Summary
In this article, I explored various strategies to optimize the startup time of a Spring Boot application. The configurations tested included standard application jars, layered jars, the use of the Spring Indexer, Class Data Sharing (CDS), AOT Cache, and native images. Each configuration was measured in a controlled Docker environment to simulate real-world deployment scenarios with limited resources.
The measurements clearly show that the choice of runtime configuration has a significant impact on Spring Boot application startup time. The native image approach delivers the fastest startup by a wide margin, starting in less than half a second and achieving a 98% reduction compared to the baseline fat jar. Among JVM-based options, using unpacked layered jars with Class Data Sharing (CDS) provides the best improvement, reducing startup time by nearly 30%. Layered jars alone and the use of the Spring Indexer offer moderate gains, while AOT compilation with the current setup does not outperform CDS. These results highlight that, for most JVM deployments, combining layered jars with CDS is the most effective way to optimize startup time without the complexity and limitations of native images.
References
- Class data sharing :: Spring Boot. (n.d.). https://docs.spring.io/spring-boot/reference/packaging/class-data-sharing.html#packaging.class-data-sharing.cds
- AOT Cache :: Spring Boot. (n.d.-b). https://docs.spring.io/spring-boot/reference/packaging/class-data-sharing.html#packaging.class-data-sharing.aot-cache
- GRAALVM Native Images :: Spring Boot. (n.d.). https://docs.spring.io/spring-boot/reference/packaging/native-image/index.html
- Native image. (n.d.-b). https://www.graalvm.org/jdk21/reference-manual/native-image/